
 By Tsuky
Traditional applications generate metrics, logs and traces that engineers use to understand failures and performance.
AI agents add new layers of activity.
An agent may call multiple language models, retrieve documents, invoke external tools and repeat tasks when something fails.
Each step can generate events and measurements.
At scale, this creates substantial telemetry volumes that organizations must process and retain.
Grafana Labs wants to help customers understand those systems without turning monitoring into an uncontrolled expense.
At ObservabilityCON in San Francisco on October 20, 2026, the company announced new tools for AI observability, telemetry cost optimization and automated incident investigation.
The following day, TechTarget examined the economic challenge behind the announcement: companies increasingly need to spend money on observability to find opportunities for reducing their infrastructure costs.
AI agents introduce a new source of telemetry growth
Observability relies on technical signals that help engineers understand system behavior.
Metrics measure performance. Logs record events. Traces reconstruct the path of an operation through different services.
AI applications require additional information.
Teams may need to know which model handled a request, how many tokens it consumed, which tools were called and how long each operation took.
A single agent task can involve many separate steps.
As usage grows, the resulting telemetry can become expensive to ingest, store and query.
This creates two related spending categories.
Organizations pay model providers or infrastructure operators to execute AI workloads.
They may then pay observability vendors to collect and analyze the records describing those workloads.
The expenses are calculated differently, but both can increase as agent usage grows.
Agent Observability tracks AI activity alongside other services
Grafana announced general availability of Agent Observability with OpenTelemetry support.
The product is designed to help developers understand what production agents are doing and how much their operations cost.
Teams can examine generation activity, latency, errors, token consumption and spending patterns.
This makes it possible to investigate expensive workflows rather than looking only at overall model invoices.
For example, an agent may complete a task successfully but require many unnecessary model calls.
Another optimization might reduce token usage while increasing latency or failure rates.
Observability helps engineers examine those tradeoffs.
OpenTelemetry is an important part of Grafana's approach.
The open standard provides conventions and instrumentation tools for collecting and transporting telemetry.
By supporting OpenTelemetry, Grafana aims to integrate AI agent monitoring with existing application observability systems.
That does not mean every agent framework automatically produces identical or complete data.
The quality of the resulting analysis depends on instrumentation and the information exposed by the application.
Monitoring costs are separate from model execution costs
Grafana's pricing documentation distinguishes several categories of Agent Observability usage.
Generation telemetry covers information about model interactions.
LLM-based evaluations and guardrails may consume additional tokens.
Metrics and traces follow the platform's normal telemetry pricing.
Those charges do not include the cost of running the underlying model.
The model provider bills separately for that execution.
Grafana says billing for generation monitoring and relevant evaluation usage began on October 1, 2026.
The commercial proposition is therefore improved cost visibility, not free monitoring.
Organizations deploying large numbers of agents need to understand both categories when calculating the total cost of their AI applications.
Adaptive Telemetry targets unnecessary data collection
Grafana's second major focus is reducing the amount of telemetry that must be retained.
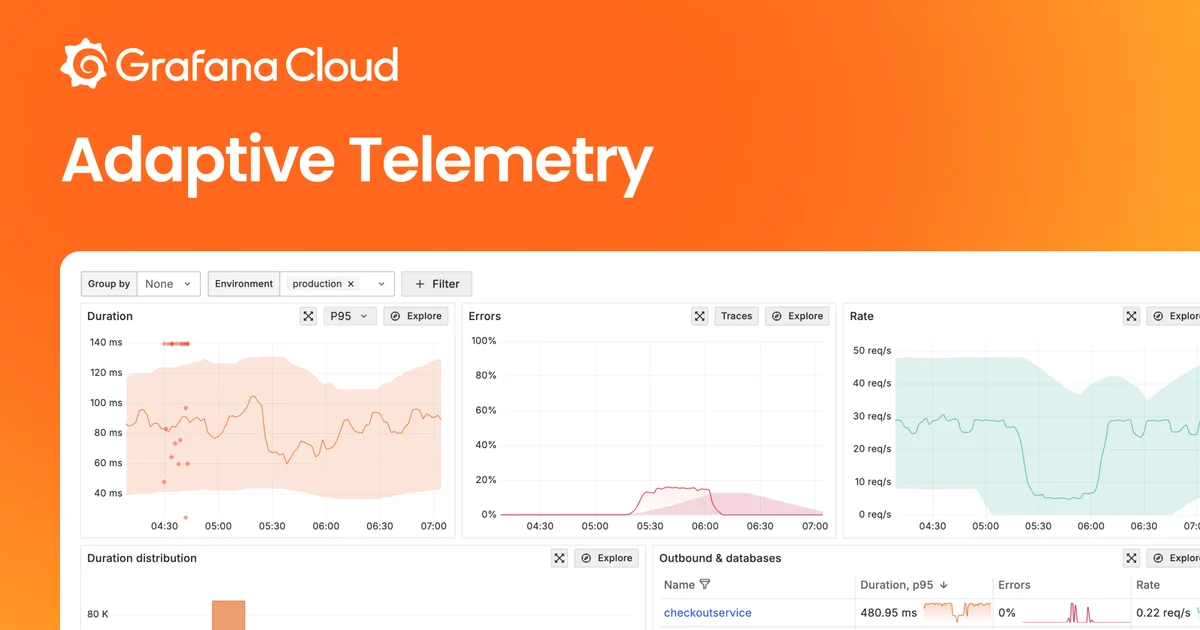
Adaptive Telemetry combines techniques for optimizing metrics, logs, traces and profiles.
Large applications can generate enormous numbers of repetitive events.
Keeping every record indefinitely is not always necessary for diagnosing incidents.
However, removing the wrong information can make an investigation impossible.
The challenge is to distinguish valuable signals from data that adds cost without delivering sufficient operational benefit.
Grafana says customers using Adaptive Telemetry have reduced telemetry spending by 30% to 50% on average.
This range is a vendor-reported outcome.
It is not a guaranteed saving for every customer or every workload.
Security investigations, auditing requirements and compliance rules can also limit how aggressively organizations reduce retained data.
Adaptive Metrics can automatically apply recommendations
Adaptive Metrics auto-apply is now generally available.
The capability automatically implements selected optimization recommendations intended to reduce unnecessary metric series.
Metric cardinality can become a major cost driver when measurements are combined with many dimensions.
An application might track the same performance indicator across services, containers, environments and other labels.
As combinations multiply, the number of active time series can grow rapidly.
Aggregating or removing dimensions that are no longer needed can reduce that volume.
Grafana says its approach is designed to preserve existing dashboards and alerts.
A cost-first mode applies recommendations only when they will not increase the total number of active series.
This safeguard is intended to prevent automatic optimization from unexpectedly increasing costs.
Teams still need to ensure that changes preserve the measurements required for their operational decisions.
Archived logs can remain available outside Grafana Cloud
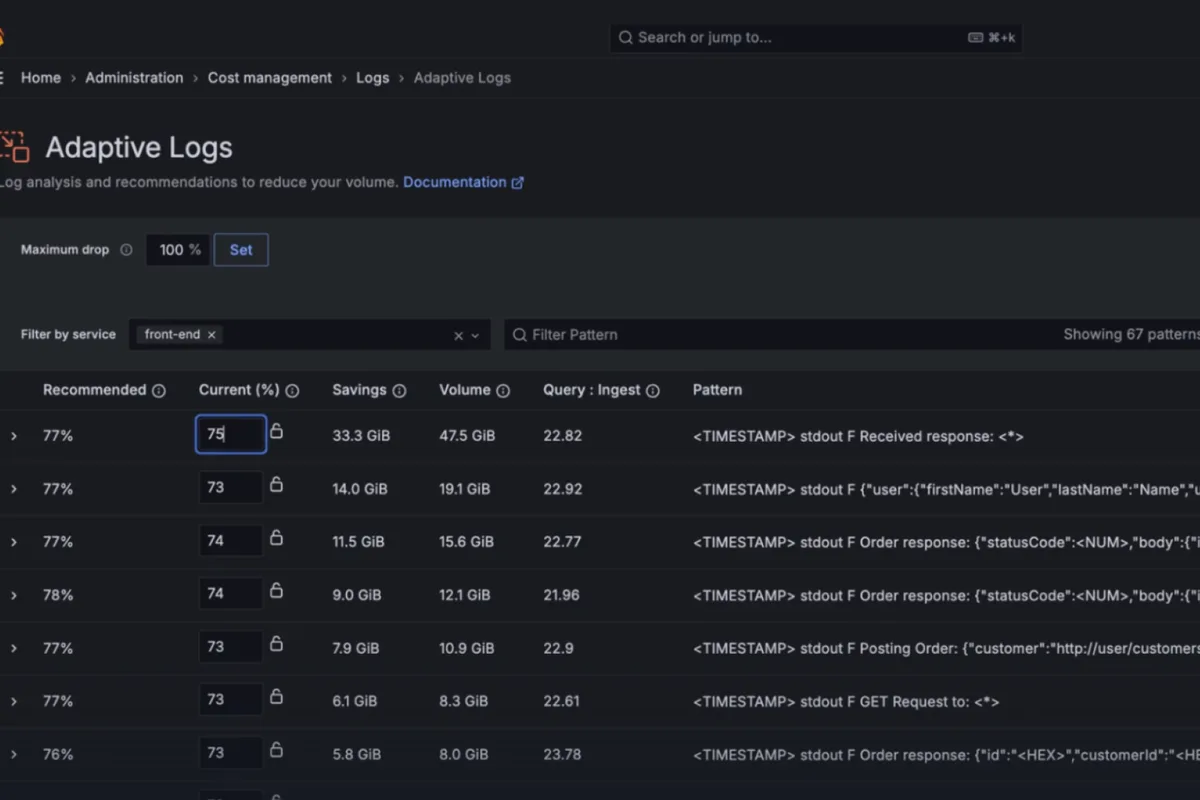
Adaptive Logs Archive is now in public preview.
The feature allows customers to route selected logs into object storage they control.
Instead of keeping every record within the active Grafana Cloud logging environment, organizations can retain some information in lower-cost storage.
This may be useful for data that is rarely accessed but must remain available for security investigations, audits or compliance requests.
Grafana also plans Adaptive Logs replay, which would allow customers to bring archived data back for analysis.
That capability remains in private preview.
The arrangement introduces operational tradeoffs.
Archived data may take longer to retrieve, and replaying it can create additional processing or ingestion costs.
Customers therefore need clear rules determining which information must be immediately searchable and which can be stored for later retrieval.
Faster log search aims to shorten investigations
Grafana also introduced generally available improvements to full-text search in Grafana Cloud Logs.
The updates use technology associated with the company's Logline acquisition.
They are designed to speed up searches for uncommon values within large log datasets.
An important error may occur only once among millions of routine events.
Finding that event quickly can make a substantial difference during an investigation.
Grafana says the new approach can deliver relevant search results within seconds for supported workloads.
Actual performance depends on dataset characteristics, storage arrangements and the queries performed.
The claim should not be interpreted as a universal guarantee that every log search will complete in a fixed time.
Faster search can also benefit AI agents performing investigations because those agents rely on retrieving relevant evidence from operational data.
Assistant Watchers brings automated anomaly detection
Grafana is also using AI agents to monitor conventional applications.
Assistant Watchers is now generally available.
The tool lets teams describe what they want to monitor in natural language.
It examines historical telemetry to establish normal patterns and identifies changes that may deserve attention.
Traditional monitoring often relies on predefined alert thresholds.
These are effective for known conditions but may miss unusual patterns that do not breach an established rule.
Watchers is intended to complement that approach.
Grafana says findings include the technical evidence behind the observation and can be routed through existing alerting workflows.
Critical findings can trigger deeper automated investigations.
The challenge will be controlling false positives and ensuring that the resulting alerts remain useful.
Automated detection can reduce manual work only if it avoids overwhelming teams with irrelevant findings.
Managed Sandboxes prepares fixes for human review
Grafana Managed Sandboxes extends the automation concept beyond investigation.
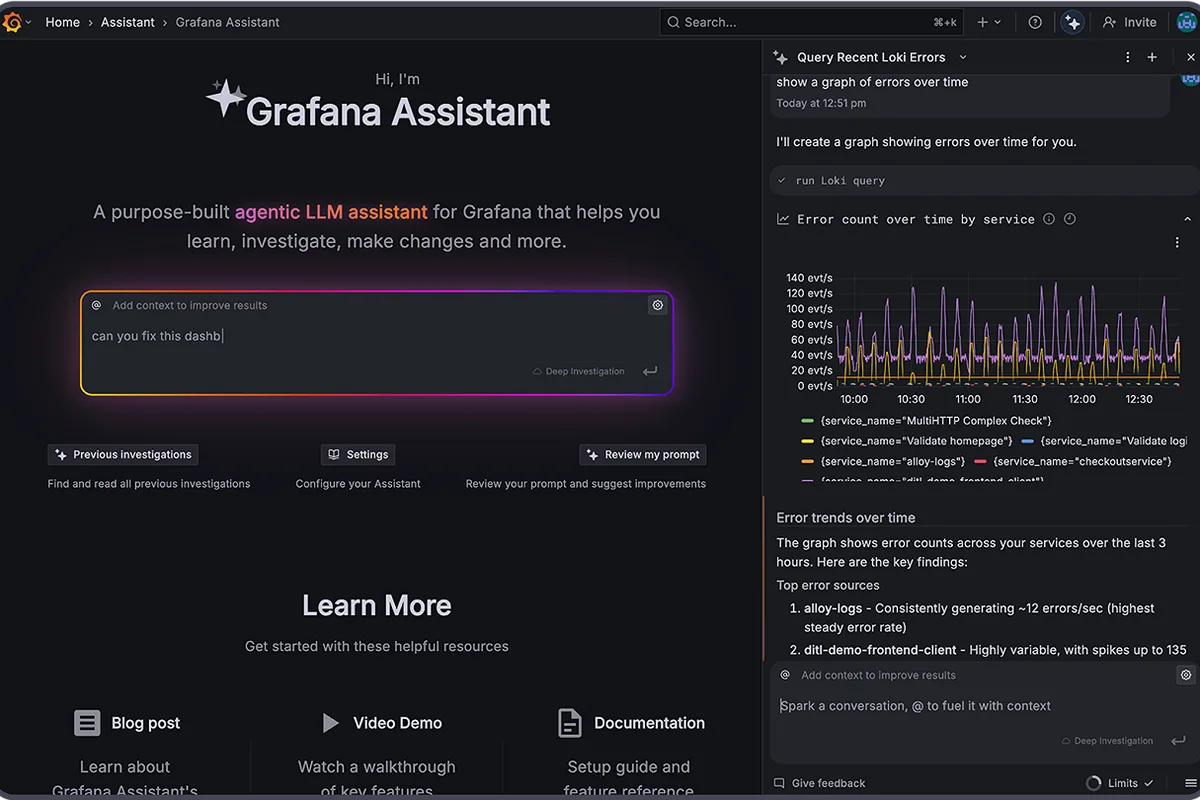
Now in public preview, the feature provides a controlled cloud environment where Grafana Assistant can examine repository code alongside production telemetry.
The assistant can investigate a problem, prepare changes and open a pull request.
A human developer is expected to review and approve the proposed fix.
This is not a general announcement of unrestricted autonomous changes to production systems.
The distinction matters because engineering teams remain cautious about allowing AI to modify infrastructure without supervision.
In Grafana Labs' 2026 State of Observability survey, conducted with ETR, 85% of 300 IT and engineering leaders said they were comfortable with AI performing read-only investigations.
Only 52% expressed comparable comfort with fully autonomous remediation.
Those percentages describe the survey sample rather than the entire global engineering workforce.
They nevertheless illustrate a difference between accepting AI-generated analysis and trusting an agent to execute changes independently.
Reported productivity gains come from a small study
Grafana also cites research published by IDC in September 2026.
According to the report, organizations using Grafana's AI capabilities reduced mean time to resolution by 63%.
They also spent 46% less time gathering context during on-call shifts.
These are substantial reported improvements, but they require context.
The research was sponsored by Grafana Labs and based on four organizations.
IDC characterizes the findings as directional rather than universally representative.
The results do not prove that every deployment will produce the same savings.
Operational maturity, the quality of available telemetry and existing incident management practices can substantially affect the outcome.
The study nonetheless illustrates why vendors are investing in automated investigation.
Observability is becoming an economic challenge
AI is changing both how software is built and how it is operated.
Companies increasingly use agents to write code, investigate incidents, monitor services and propose changes.
Each new automated system creates additional activity that may need to be recorded and reviewed.
More automation can therefore increase the need for observability.
This creates tension between comprehensive visibility and sustainable spending.
Storing everything may become too expensive. Discarding too much information can compromise security investigations or make failures difficult to explain.
Grafana is responding with a combination of telemetry optimization, faster search and AI-assisted operations.
Its strategy has two complementary elements.
Observability for AI helps developers understand the agents they deploy.
AI for observability uses agents to investigate and monitor the rest of the technology stack.
The two approaches have overlapping technology but different operational responsibilities.
General availability and previews need to be distinguished
The ObservabilityCON announcements represent different stages of product maturity.
Agent Observability with OpenTelemetry support, Assistant Watchers and Adaptive Metrics auto-apply are generally available.
Adaptive Logs Archive, Grafana Managed Sandboxes and Grafana Pages are in public preview.
Adaptive Logs replay remains in private preview.
These distinctions matter for companies deciding whether to incorporate the features into production operations.
Preview capabilities may have different availability, support conditions or feature limitations from generally available services.
Organizations must also define policies for data retention, access control and the types of changes automated agents are allowed to propose or execute.
As of October 22, 2026, Grafana's new product releases are confirmed, but the savings available to any individual organization remain dependent on its workload.
The broader challenge is clear: companies cannot scale AI agents indefinitely without understanding both the cost of their execution and the expense of monitoring them.
Grafana's bet is that better telemetry economics and carefully supervised automation can make both sides of that equation more manageable.